HI 6326 Session 7
Overview:
- Lecture 1: 3D Electron Microscopy
History (PDF
file)
- Video Lecture: Michael
Moody, Helical Reconstructions (640x480
RealVideo, 5
fps, 620MB)
- Homework 2
Resources and Assignments:
1. If you are
interested in cryo-EM Specimen Preparation (not discussed in Lecture 1):
Note: References 6 and 10 in the Butcher review are in the Biomachina
lab library
2. Here are the
PDF's of the historic papers and reviews mentioned in Lecture 1:
-
Cochran, Crick, &
Vand, 1952
(FT of helix)
-
Klug, Crick,
& Wyckoff, 1958
(selection rule, n-l plot)
-
DeRosier &
Klug, 1968 (the
first ever paper on a 3D reconstruction from EM)
-
Stewart, 1988 (great review of helical
reconstruction technique)
-
Moody, 1990 (of
course)
3. The handout
of the Video Lecture can be downloaded
as a PDF
file
here.
4. Homework 2 (due at last session):
Background:
Actin
filaments are dynamic polymers whose ATP-driven assembly in the
cell cytoplasm drives shape changes, cell locomotion and chemotactic
migration. Actin filaments also participate in muscle contraction. The
structure of the filament is not known at atomic resolution, but
several models were produced in the laboratory of Ken Holmes
(Max-Planck Institute for Medical Research, Heidelberg, Germany) by
refinement against X-ray
fiber diffraction data:

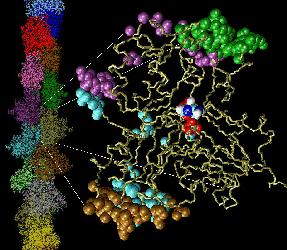
Fig. 1 (click to enlarge): A single actin monomer with inter-actin
contact surfaces is shown on the
right, the entire actin filament on the left. The figure is copyrighted
by W.W.
Assignment:
Read the
hands-on practical
guide for helical indexing by David DeRosier. Using the
helical selection rule, draw a "n-l" plot for actin filaments in both
13/6 symmetry (l=
-6n+13m)
and 36/17 (l=
-17n+36m) symmetry (see section
12.,
page 10). Actin can be found in both
symmetries (and other ones!)
because there is some torsional flexibility in the filaments that can
accommodate a variable twist. Now, draw an "n-Z" plot, assuming that
one actin subunit has a rise of 27.5 Angstrom. Calculate the Z value
(length of helical repeat) l=1 corresponds to, for 13/6 and 36/17. Then
normalize
the "l" axis in
both cases to get the Z axis. See
Figure 5, page 15, in the handout as an example of an n-Z plot. Note
that the twist angle per monomer is obviously -170 degrees for 36/17
symmetry. Since this angle is close to -180 degrees, actin seems to
have
the appearance of a right-handed two-start helix instead of a
left-handed one-start helix.
Calculate how this twist angle changes for 13/6 symmetry. You should
verify that despite
the large difference in indexing and n-l plots we really
have very similar filaments here, so their diffraction patterns should
also be very similar. Can you find this similarity in the n-Z plots?

